Browse Admin Console
- Dashboard overview
- Insights overview
- Sites Overview - Network Deployments
- Policies Overview - Create and Edit
- Custom Lists overview
- Clients Overview - Device Agents and Profiles
- Users Overview - Directory Users and Personas
- Organizations Overview - MSP Tenant Management
- Lookup Tool Overview
- Query Log Overview
- Settings Overview - Account Administration
- Help & Support Overview
- Signing In - Login, 2FA, and Password Reset
- Two-factor authentication (2FA)
- Add system users (role-based access)
- Check domain classification with the Lookup Tool
- Configurable objects and their associations
- Configure notifications
- Working with organizations (multi-tenant)
- Working with policies
- Content categories
- Security categories
- Application categories (Zero Trust app management)
- Working with allow and block lists
- Zero Trust TLD Filters
- Safe Search explained
- Safe Search supported search engines
- YouTube Restricted Mode explained
- Custom block pages
- Prevent DNS bypass
- Don't mix DNS providers
- Active Directory group policies
- Entra ID group policies
- Tracking individual users
Organizations Overview - MSP Tenant Management
Partition ScoutDNS into customer organizations: per-tenant health from one MSP dashboard, linked sites and personas, and usage and billing reports.
Organizations partition one ScoutDNS account into customer tenants, which makes this page the MSP command center: every tenant’s health on one screen, a drill-down dashboard per tenant, the links that assign sites, roaming client profiles, and personas to each tenant, and per-tenant usage and billing reports ready for invoicing.
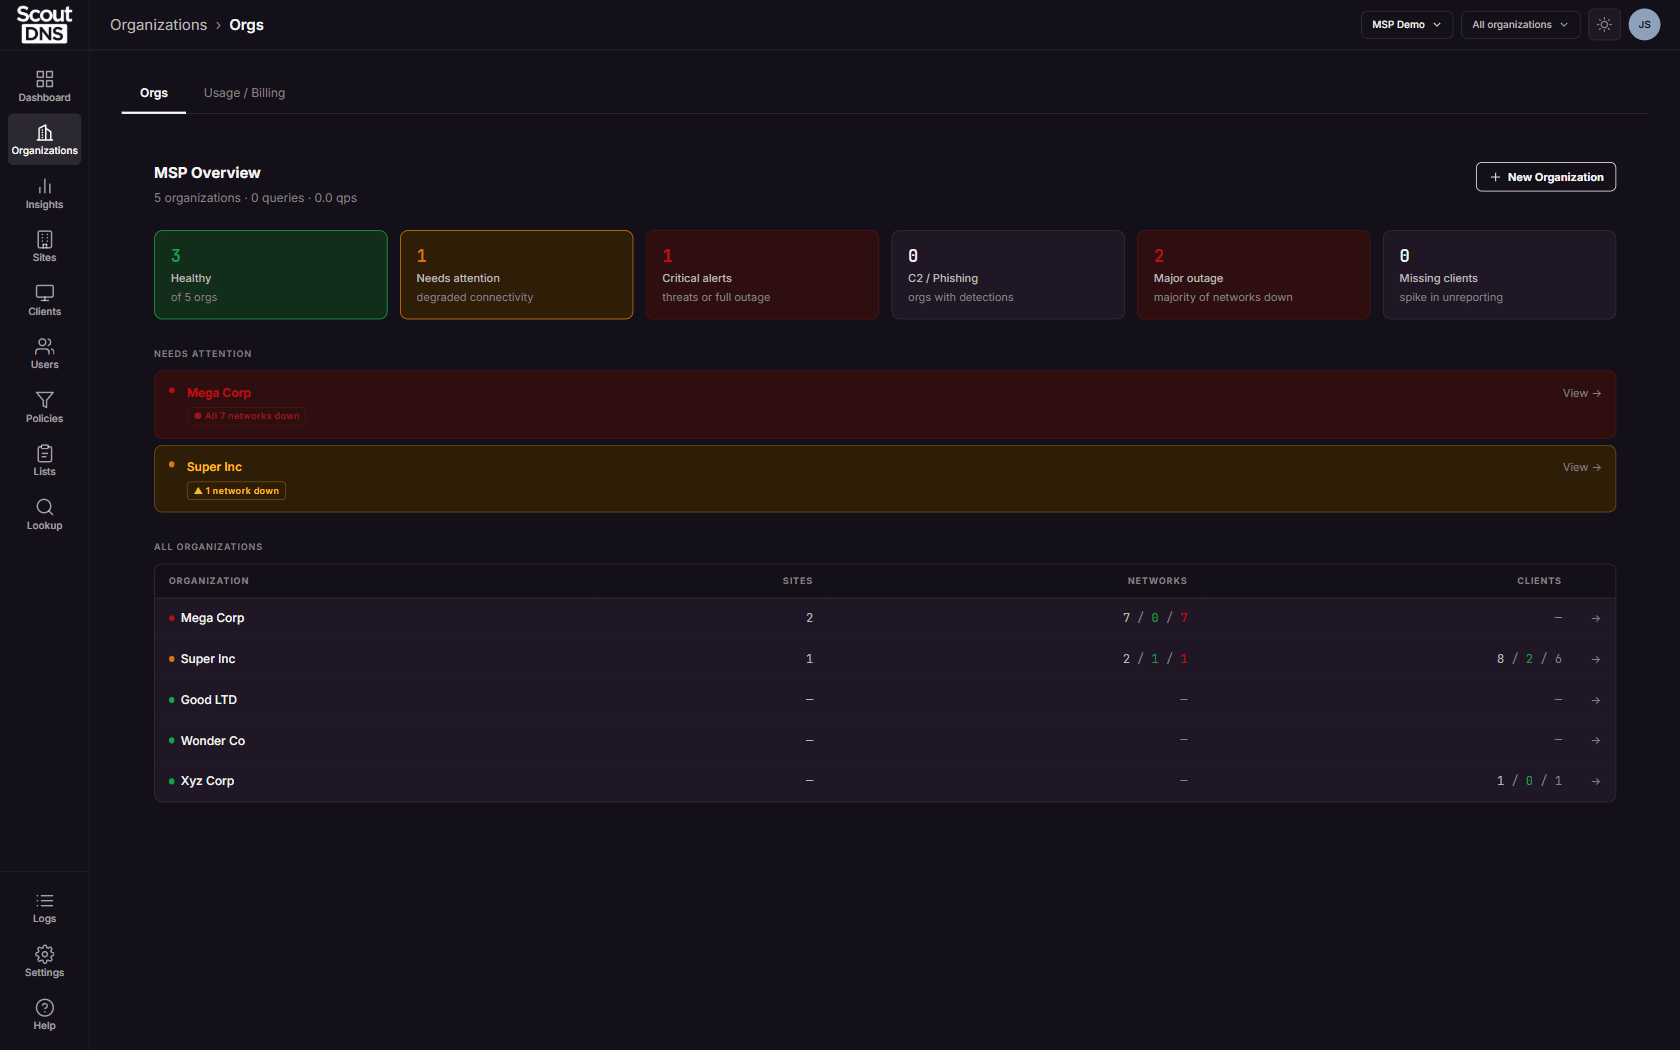
[!NOTE] Organizations manages all tenants, so it only exists in the All organizations scope. If you have a specific organization selected in the header, the page disappears from the sidebar; switch back to All organizations to reach it. Organization operators, who live inside a single org scope, never see this page. Viewing is open to account-level roles; creating, editing, deleting, and linking need an Admin.
The MSP Overview
Landing on the page shows the whole account: six summary cards (Healthy, Needs attention, Critical alerts, C2 / Phishing, Major outage, Missing clients), a Needs Attention list of tenants with active alerts, and a sortable All Organizations table with each tenant’s sites, network up/down counts, and client online/offline counts.
New Organization (top right, Admin role required) creates a tenant with a name and optional description; the “Select an organization” dialogs on Sites, Clients, and Users shortcut here too. For the creation steps and everything that follows (linking, object scoping, organization operators), see Working with organizations.
Inside a tenant
Click an organization to open its detail view. A left rail groups all tenants by severity (Critical / Needs attention / Healthy) for fast switching, and the main pane shows the tenant’s live picture:
- A threat banner: all-clear, an amber “N threats blocked”, or a red “Malware C2 detected” alert, each clicking through to the filtered Insights view.
- A worst-first Sites strip with per-site WAN and relay up/down bars.
- Query volume with the allowed/blocked split, Online Now client and user counts, an expandable Missing Clients list linking into Clients, live performance, and seat tiles.
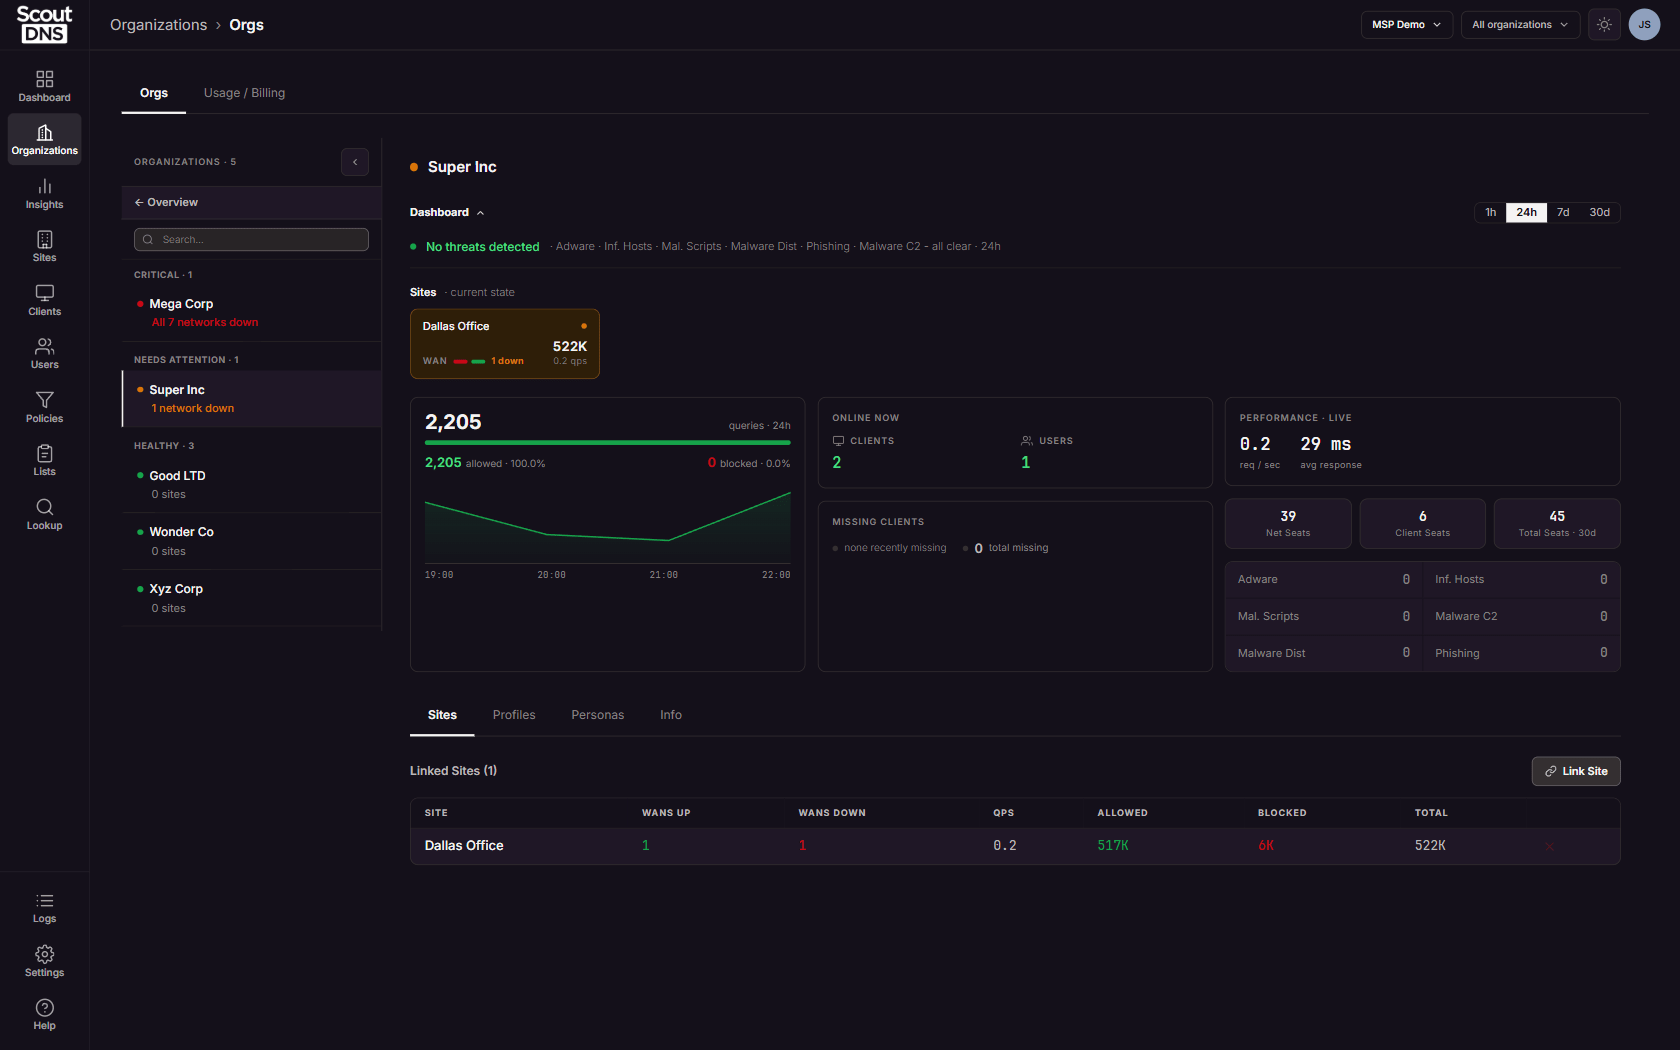
[!NOTE] The seat tiles always show the rolling last 30 days regardless of the dashboard’s time-range picker, so they match the Usage / Billing tab.
Linking resources to a tenant
Organizations do not contain resources; they link them. Sites, roaming client profiles, and personas exist at the account level, and the Sites, Profiles, and Personas sub-tabs attach them to the tenant. Anything left unlinked stays account-level and shows under “
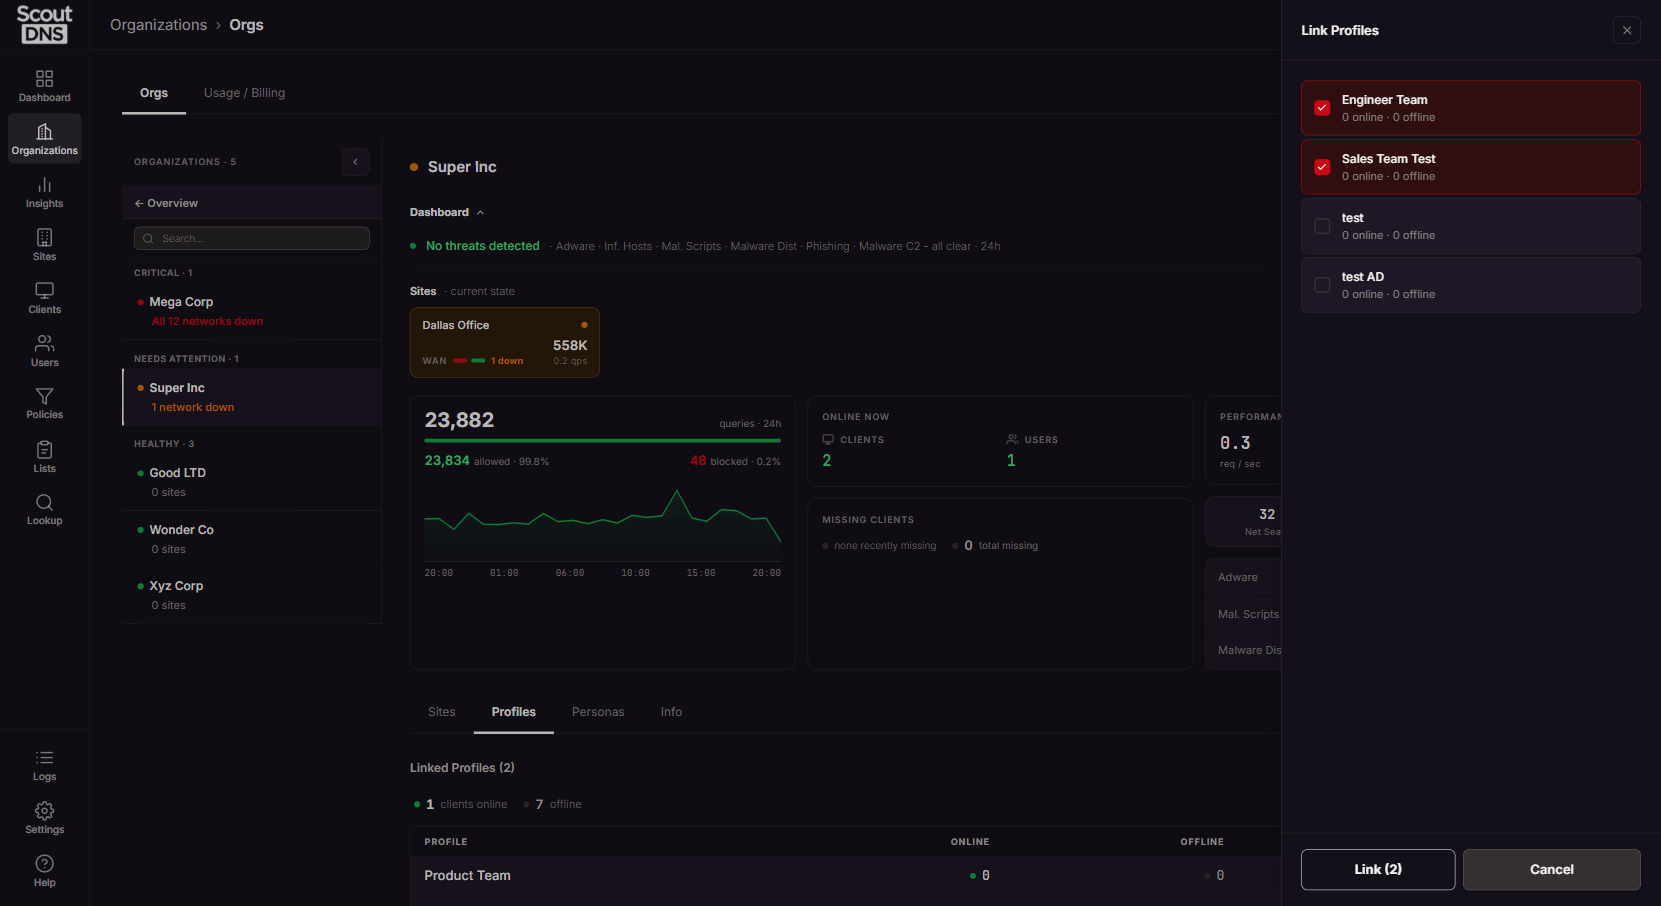
Each sub-tab lists what is linked, with per-row unlink and click-through to the owning page. Link Site / Link Profile / Link Persona open a multi-select of everything not yet linked.
Policies and custom lists work differently: they are scoped to an organization on their own pages (see Policies Overview), not linked here. Operator accounts are managed under Settings, not on this page.
The Info sub-tab holds the tenant’s name and description, Edit, and a Danger Zone with Delete Organization (confirmed before deleting; it cannot be undone).
Usage and billing
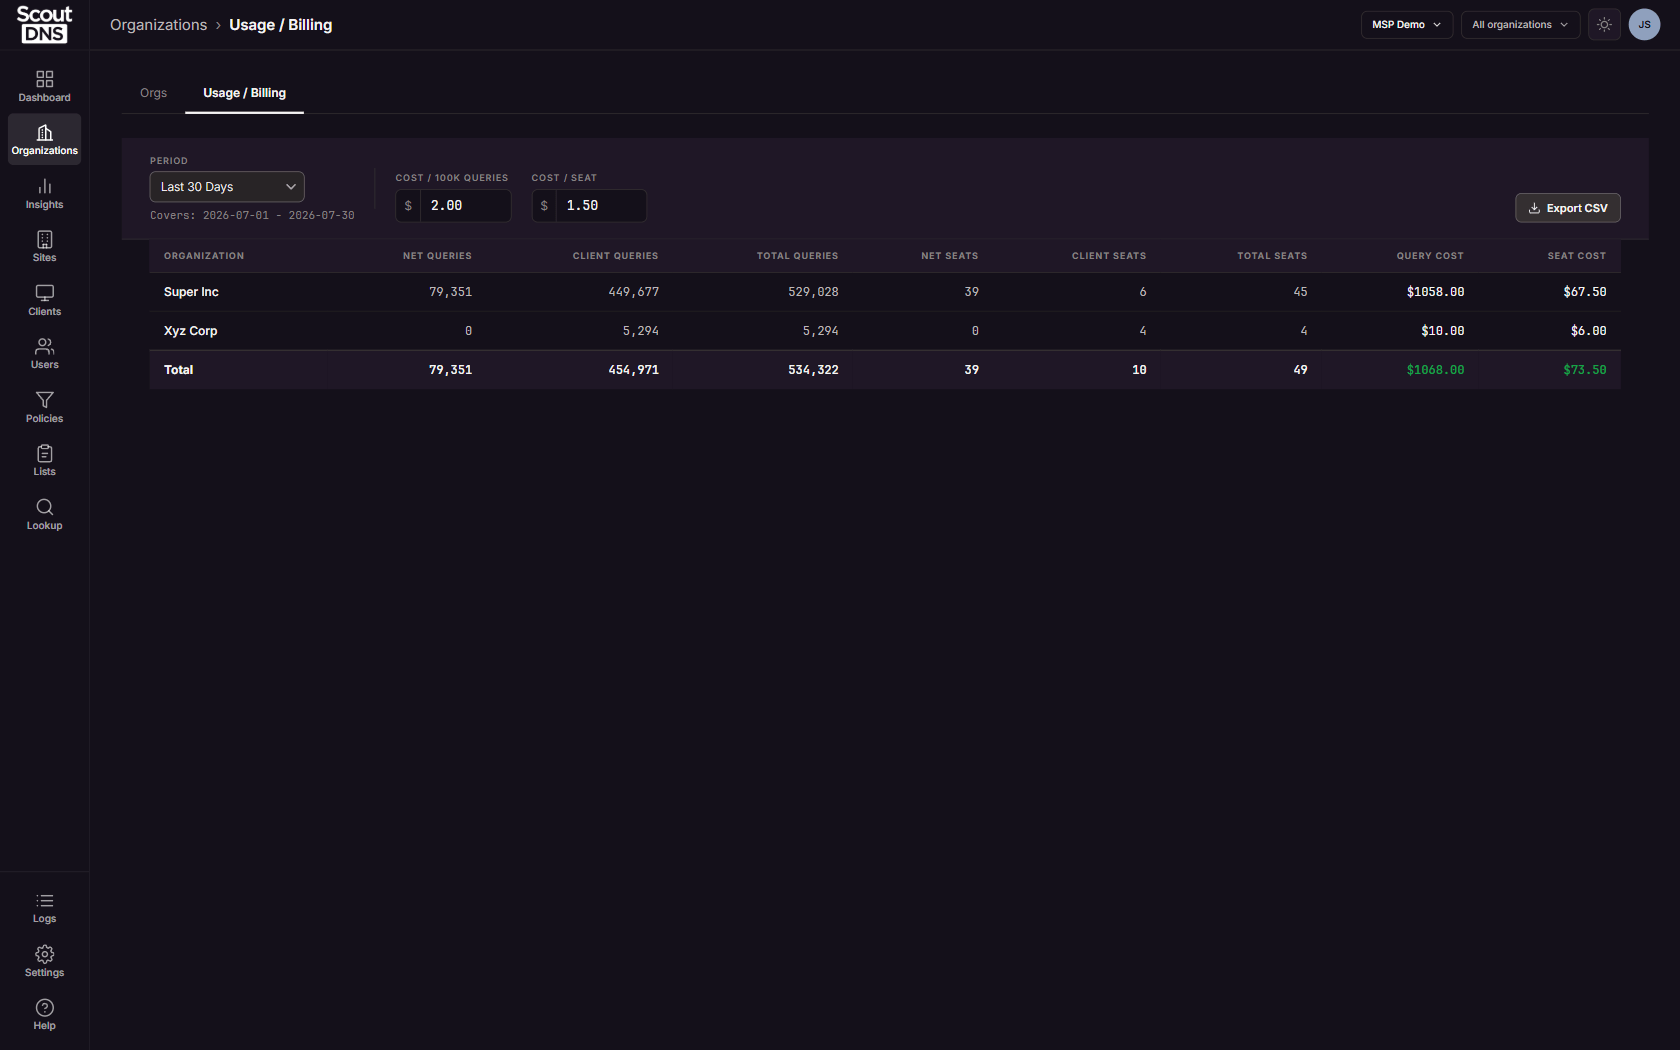
The Usage / Billing tab turns per-tenant usage into an invoice-ready report. Pick a Period (Last 30 Days, or a Custom Invoice Date that covers the month ending the day before the invoice date), optionally enter your Cost / 100K Queries and Cost / Seat rates, and the table shows each tenant’s network and client queries, seats, and computed costs, with a total row. Export CSV downloads it.
FAQ
I can’t find the Organizations page. Check the header scope selector: the page only exists in All organizations. If you are an organization operator, the page is not available to your role.
I created a site but it isn’t in my customer’s organization.
Resources start account-level. Open the organization, go to its Sites sub-tab, and Link Site. Until then it bills under “
An organization’s dashboard is empty. Its stats aggregate from its linked sites. Link at least one site and the dashboard fills in.
Why don’t the seat numbers change with the time range? Seats are always the rolling last 30 days so they agree with Usage / Billing, by design.
What do the severity groups mean? Critical means threat detections or all (or most) networks down; needs attention means some networks down or a relay offline; healthy means everything up.
Related
- Working with organizations (multi-tenant), the configuration deep dive: object scoping, org tags, and organization operators
- Sites Overview - Network Deployments, the sites you link to tenants
- Clients Overview - Device Agents and Profiles, the profiles you link to tenants
- Users Overview - Directory Users and Personas, the personas you link to tenants
- Insights overview, where the threat banners drill to
- Setup and use guide for MSPs