Browse Admin Console
- Dashboard overview
- Insights overview
- Sites Overview - Network Deployments
- Policies Overview - Create and Edit
- Custom Lists overview
- Clients Overview - Device Agents and Profiles
- Users Overview - Directory Users and Personas
- Organizations Overview - MSP Tenant Management
- Lookup Tool Overview
- Query Log Overview
- Settings Overview - Account Administration
- Help & Support Overview
- Signing In - Login, 2FA, and Password Reset
- Two-factor authentication (2FA)
- Add system users (role-based access)
- Check domain classification with the Lookup Tool
- Configurable objects and their associations
- Configure notifications
- Working with organizations (multi-tenant)
- Working with policies
- Content categories
- Security categories
- Application categories (Zero Trust app management)
- Working with allow and block lists
- Zero Trust TLD Filters
- Safe Search explained
- Safe Search supported search engines
- YouTube Restricted Mode explained
- Custom block pages
- Prevent DNS bypass
- Don't mix DNS providers
- Active Directory group policies
- Entra ID group policies
- Tracking individual users
Query Log Overview
Watch DNS queries live or search 30 days back: decisions and policies per query, full DNS response detail, add-to-list, and CSV exports.
The Query Log (the Logs page) is the raw, per-query view of your DNS traffic: every query with the decision applied (allowed or blocked), the matched category and policy, and the requesting client, user, and IPs. Where Insights aggregates and analyzes, the Query Log shows individual queries as they happen, which makes it the tool for “is this domain being blocked right now, for whom, and why?”
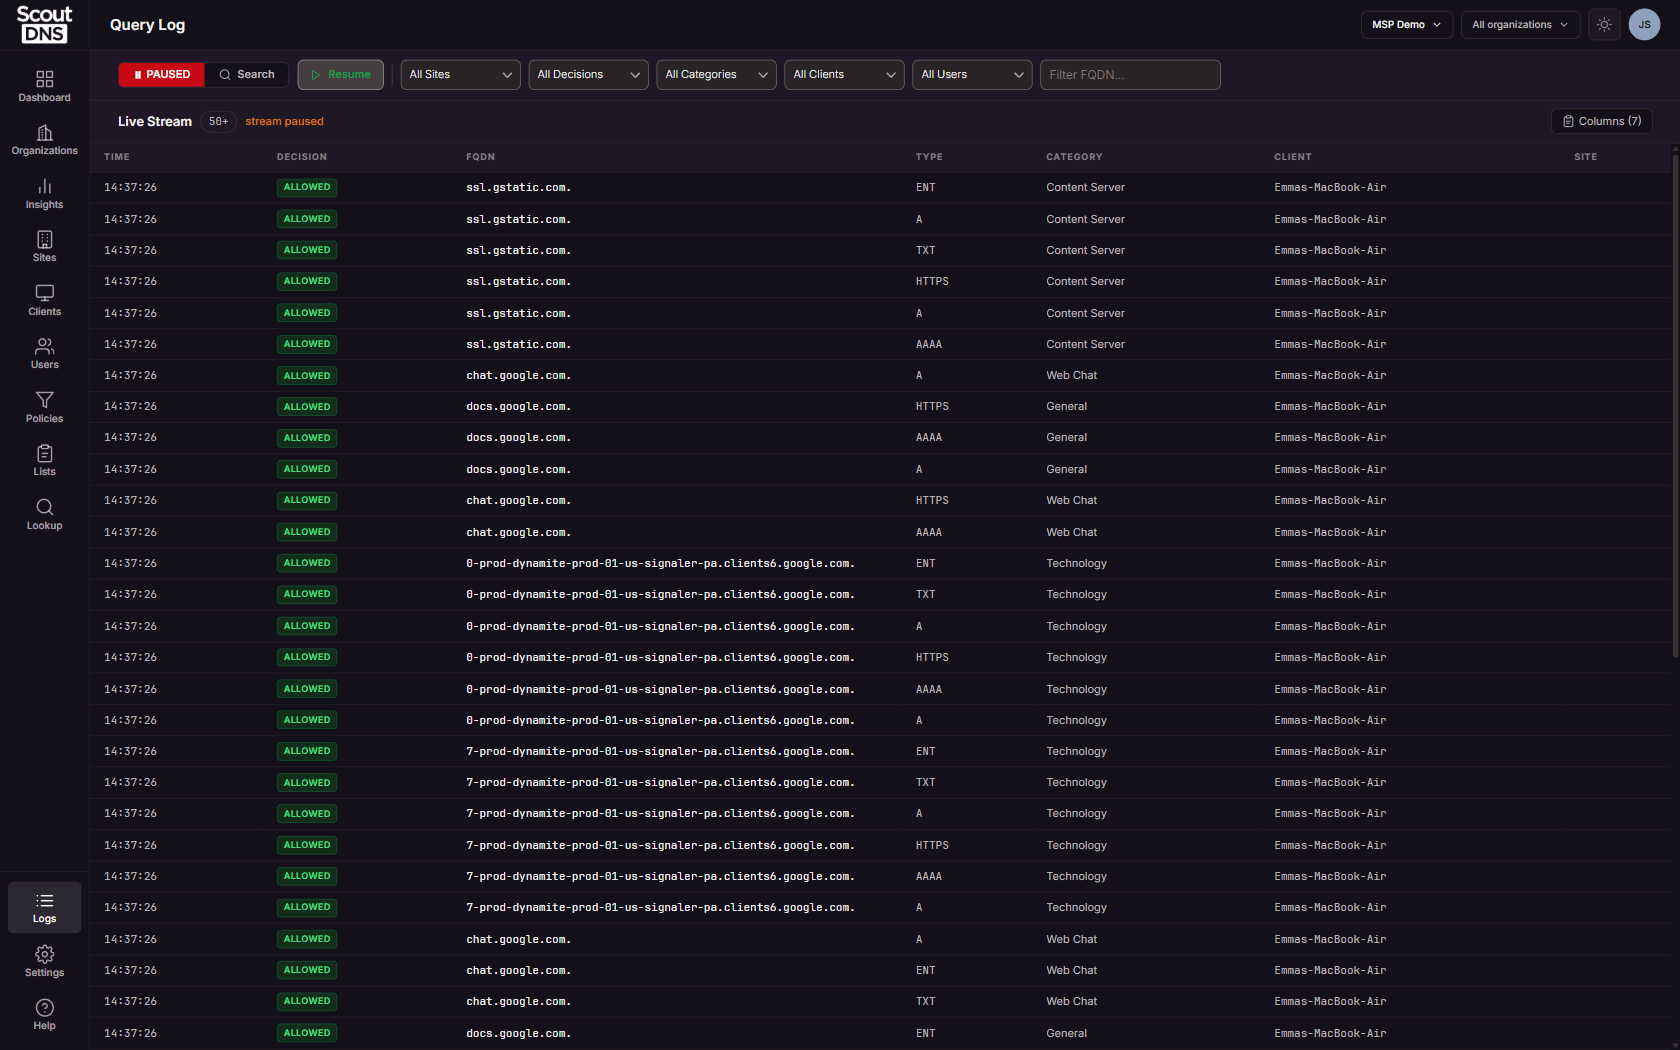
Every role can view the Query Log. It has two modes:
- Live streams today’s queries, updating every 5 seconds. Pause freezes the view; filters apply to the stream too, so you can watch a single client or domain in real time.
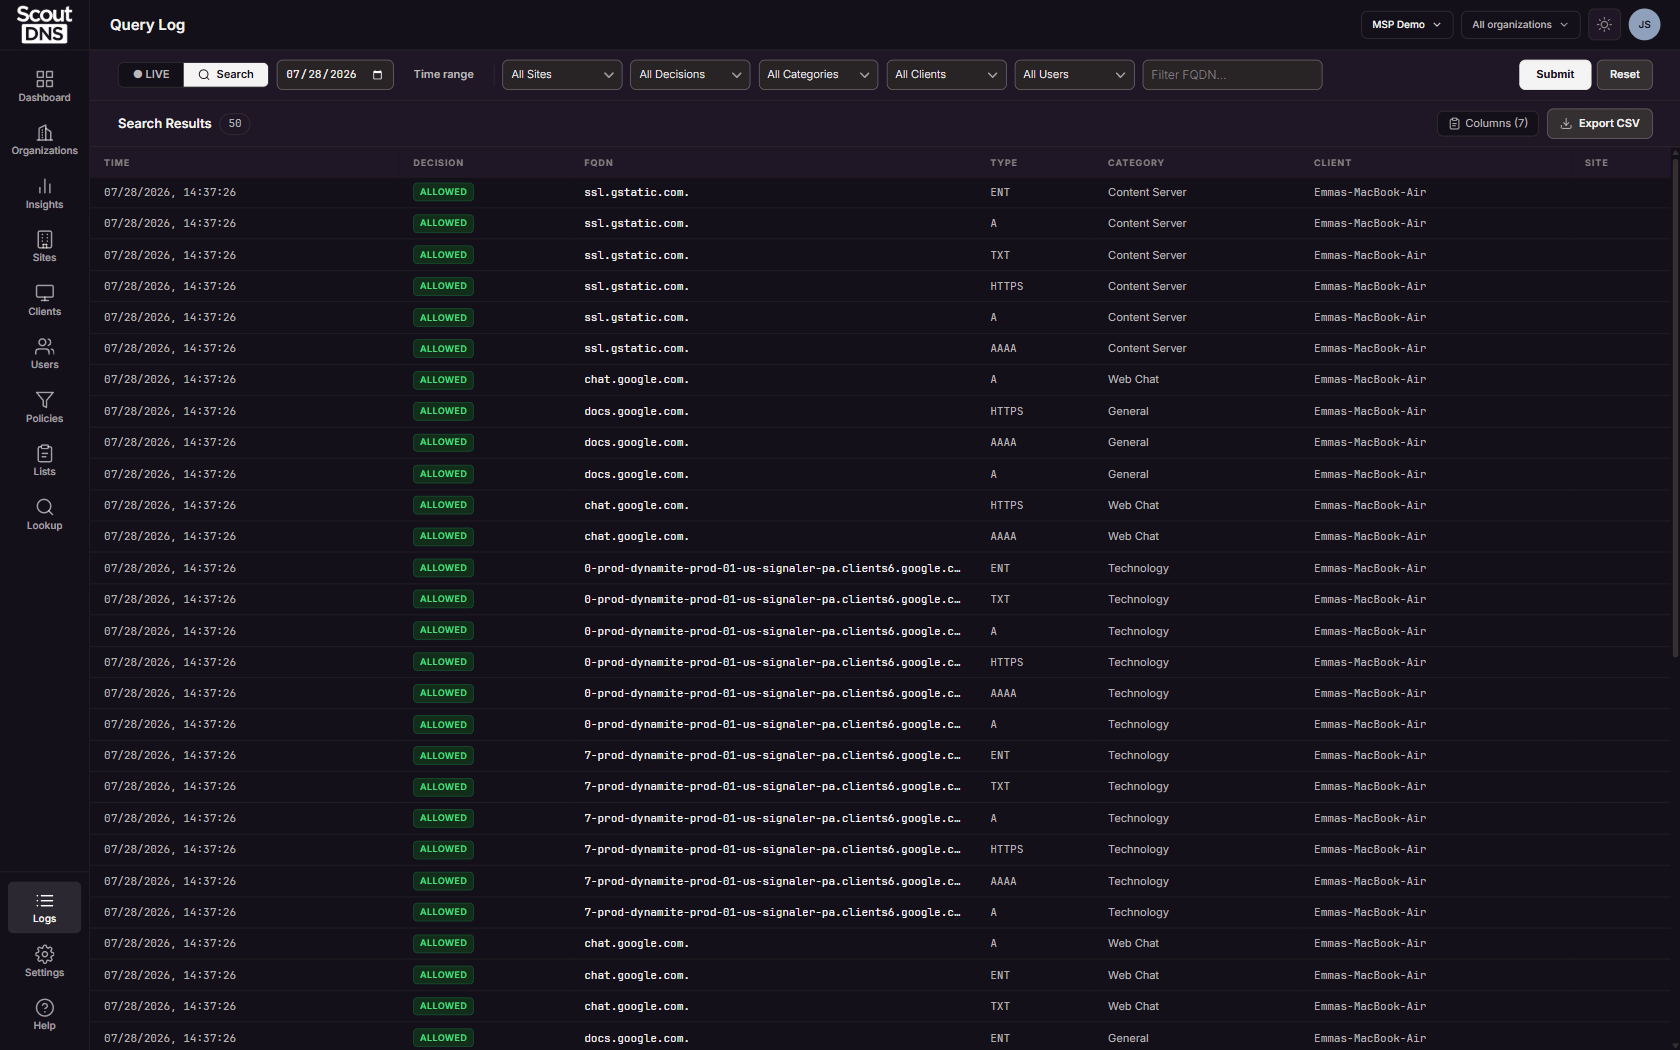
- Search investigates one calendar day at a time, up to 30 days back, with an optional time range within the day.
Filtering
Five dropdowns (Sites, Decisions, Categories, Clients, Users) plus an FQDN box narrow either mode.
[!IMPORTANT] The FQDN filter is an exact match, not a search.
www.example.comfinds queries for exactly that hostname; typingexamplefinds nothing. The Categories filter takes the four groups (Threats, Content, Applications, Allow/Block Lists) rather than individual categories; for category-level analysis use Insights.
The Columns picker chooses which of the twelve columns show (Time, Decision, FQDN, Type, Category, Client, User, WAN IP, LAN IP, Site, Policy, Source) and remembers your choice on this browser.
Query detail
Click any row for the full record. The Details tab covers the query (timestamp, FQDN, record type, resolver, latency), the decision (reason, category, policy), and the client (user, agent, WAN/LAN IPs, site). The Response tab shows the actual DNS response packet: header flags, and every record in the Queries, Answers, Authority, and Additional sections, with Copy and Print for evidence gathering.
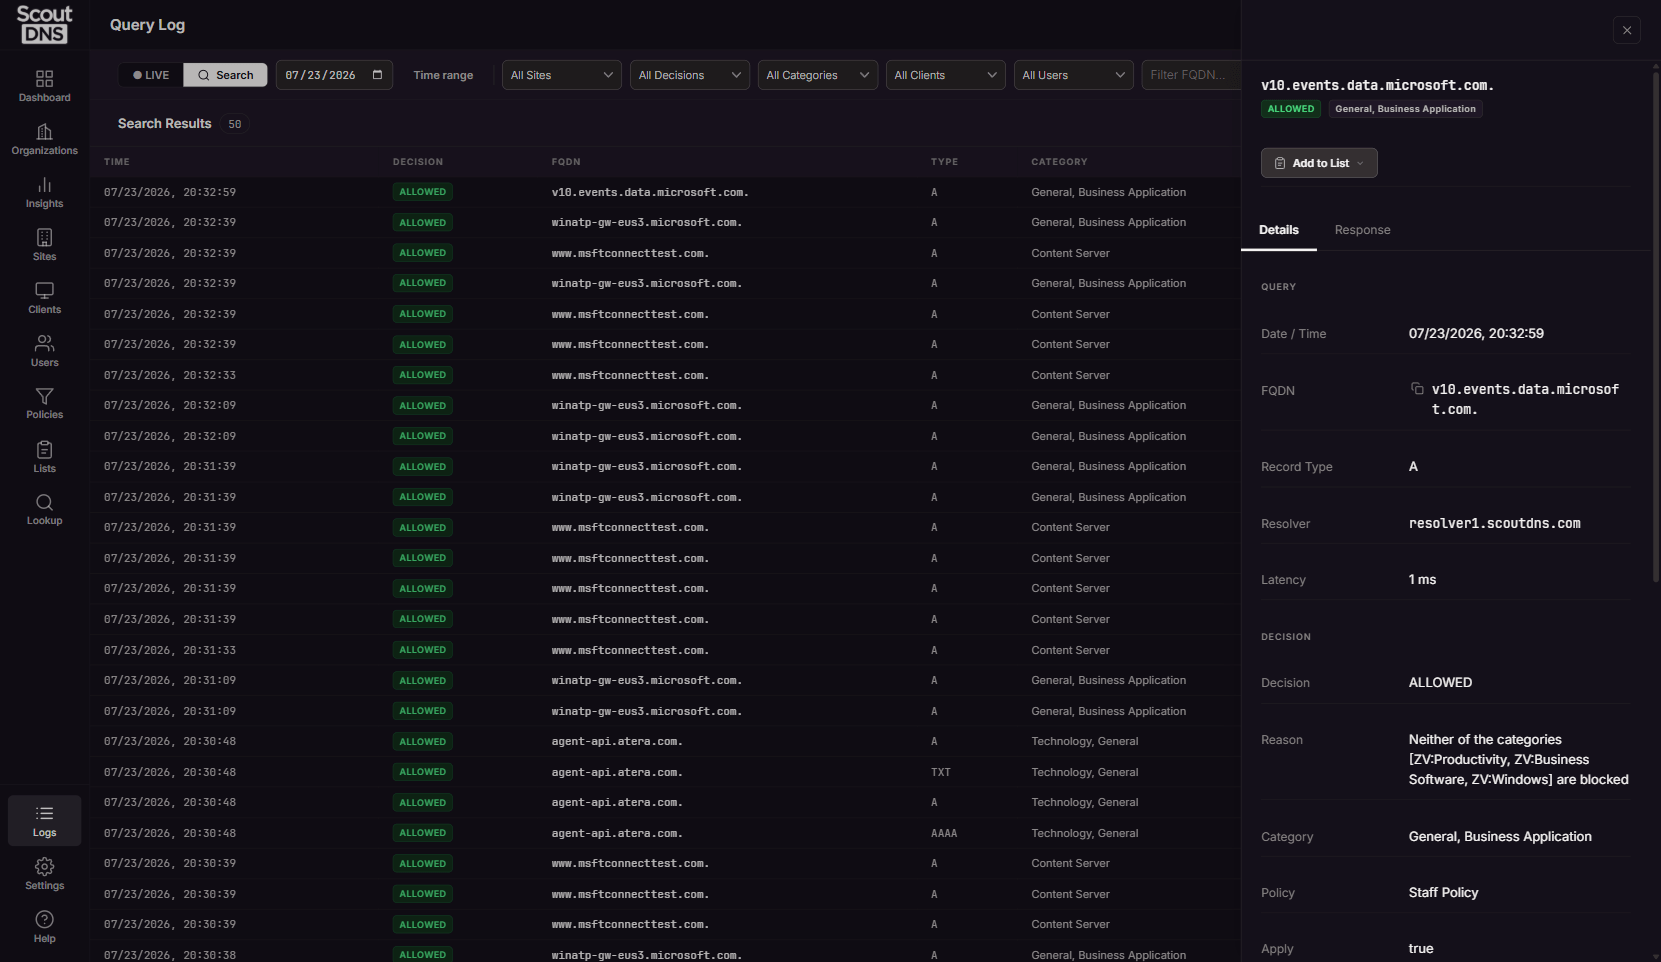
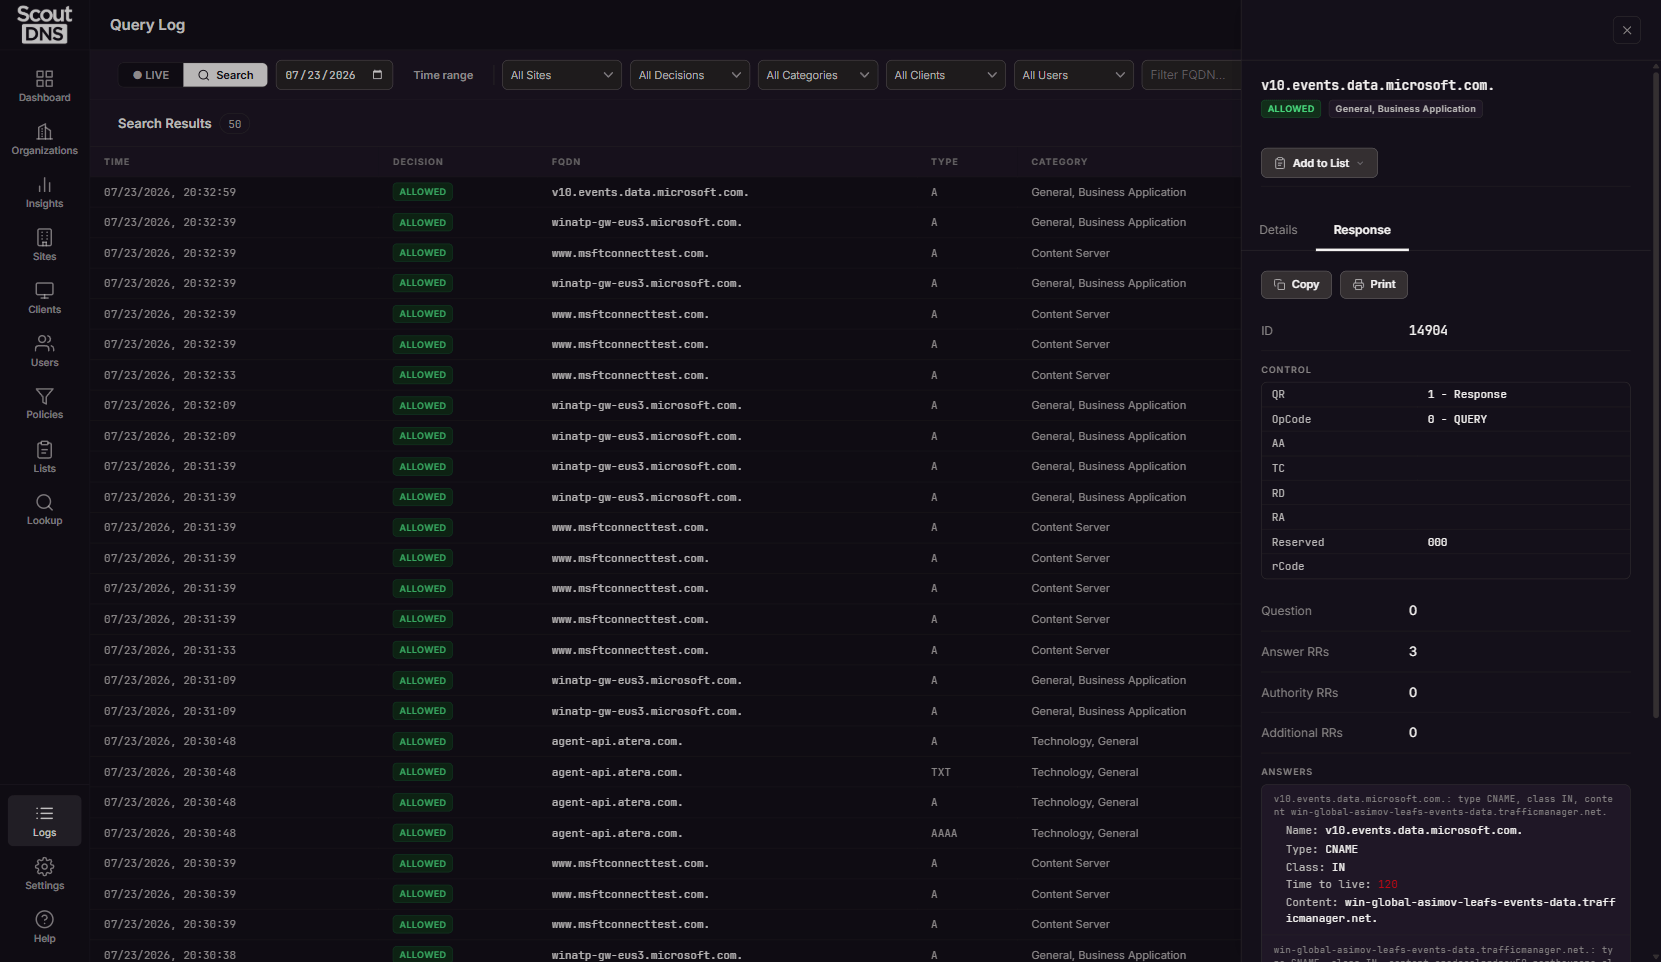
Add to List on the drawer adds the FQDN straight to an allow or block list, with Exact/Subtree choice and a note field; it shows how many lists already cover the domain. See Working with allow and block lists.
Exporting
Export CSV (Search mode) generates the export server-side and delivers it to your email rather than downloading in the browser. Limits, as shown on screen: search reaches up to 30 days back, and each export covers at most a 24-hour window. Narrow the range if the button is disabled.
For continuous log delivery to a SIEM instead of one-off exports, see SIEM data export.
FAQ
I made a DNS query but don’t see it yet. The live stream updates every 5 seconds, plus a moment for ingestion. If it still doesn’t appear, check your filters, especially the exact-match FQDN box.
I filtered by FQDN and got nothing, but Insights shows traffic for the domain.
The FQDN filter is exact. Insights aggregates by registered domain; the Query Log wants the full hostname (cdn.example.com, not example.com).
Can I search across several days at once? Search runs one calendar day at a time. For multi-day questions use Insights, or export day by day.
A user is missing from the Users dropdown. The dropdown lists usernames seen in rows loaded this session. Load rows that include the user (widen filters or search their active day) and they appear.
Where’s my exported CSV? In your email. Exports are generated server-side and sent to the address on your operator account.
Related
- Insights overview, aggregate analytics over the same data
- Working with allow and block lists, where Add to List lands
- SIEM data export, continuous delivery instead of manual export
- Tracking individual users, how the User column gets its values