Browse Admin Console
- Dashboard overview
- Insights overview
- Sites Overview - Network Deployments
- Policies Overview - Create and Edit
- Custom Lists overview
- Clients Overview - Device Agents and Profiles
- Users Overview - Directory Users and Personas
- Organizations Overview - MSP Tenant Management
- Lookup Tool Overview
- Query Log Overview
- Settings Overview - Account Administration
- Help & Support Overview
- Signing In - Login, 2FA, and Password Reset
- Two-factor authentication (2FA)
- Add system users (role-based access)
- Check domain classification with the Lookup Tool
- Configurable objects and their associations
- Configure notifications
- Working with organizations (multi-tenant)
- Working with policies
- Content categories
- Security categories
- Application categories (Zero Trust app management)
- Working with allow and block lists
- Zero Trust TLD Filters
- Safe Search explained
- Safe Search supported search engines
- YouTube Restricted Mode explained
- Custom block pages
- Prevent DNS bypass
- Don't mix DNS providers
- Active Directory group policies
- Entra ID group policies
- Tracking individual users
Insights overview
Slice DNS activity by domain, category, TLD, or record type, filter by site, policy, client, or user, and drill down to query logs.
Insights is the traffic-analytics explorer. It slices your account’s DNS query activity by domain, category, TLD, or record type, filters it by site, network, policy, client, user, and more, and drills from aggregate counts all the way down to individual query log lines. Any view can be exported to CSV, and every view has a shareable URL.
If your account has organizations, the organization selector in the header scopes all results to the selected organization.
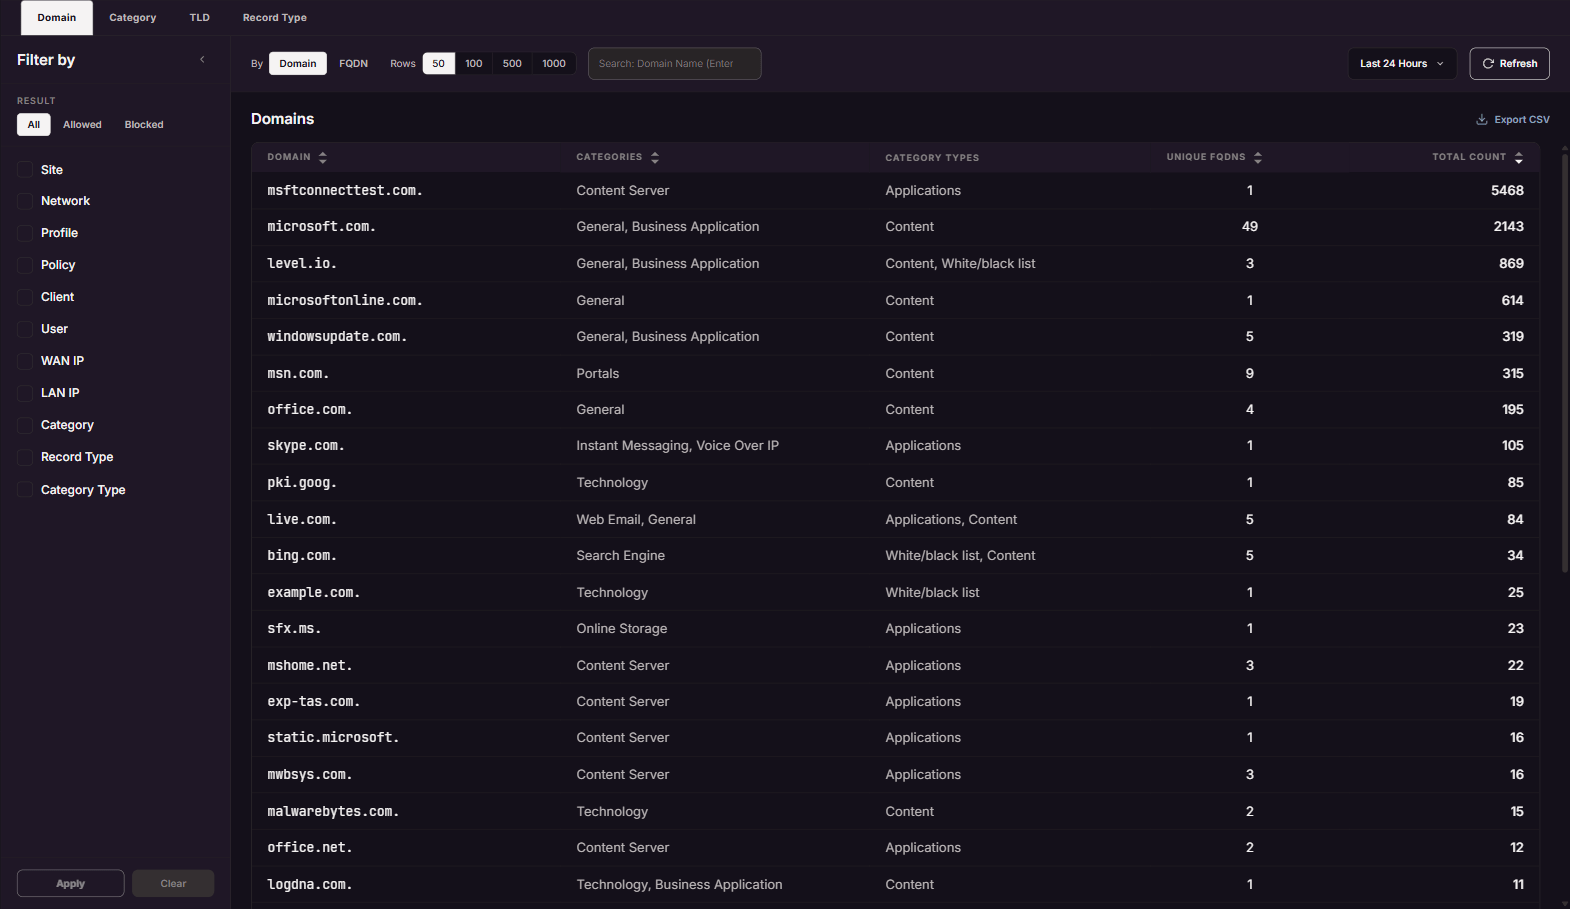
Page layout
- View tabs: Domain, Category, TLD, and Record Type control which dimension the table aggregates by.
- Time range picker with nine presets: Last Hour, Today, Last 24 Hours, Yesterday, This Week, Last Week, Last 7 Days, This Month, Last 30 Days.
- Result pills: All / Allowed / Blocked.
- Filters panel (see below).
- On the Domain tab only: a Domain / FQDN toggle and a search box (press Enter to search).
- Results table with sortable columns, a rows-per-page control, and an Export CSV link.
- Drill-down breadcrumb, which appears once you drill below the top level.
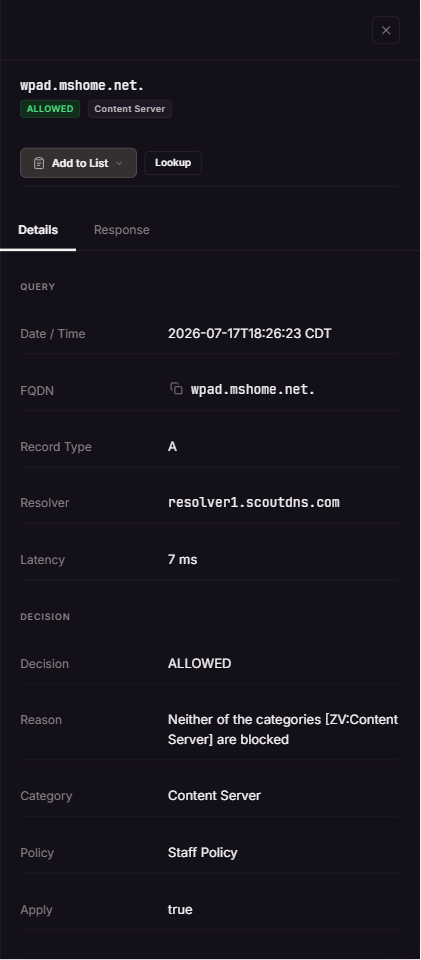
- Log detail drawer, opened from a log row, with Details and Response tabs.
[!NOTE] The default time range is Last Hour, the shortest preset. A quiet account can look empty on first visit; widen the range before concluding there’s no data.
Filtering
Available filters:
| Filter | Type |
|---|---|
| Site, Network, Profile, Policy, Client | Multi-select |
| User, WAN IP, LAN IP | Single value, free-typed or picked |
| Category | Multi-select |
| Record Type | Multi-select across the common DNS record types, A through TLSA plus ANY |
| Category Type | All / Threats / Content / Applications / White-Black List |
| TLD Type | All / gTLD / ccTLD / sTLD / infrastructure (TLD tab only) |
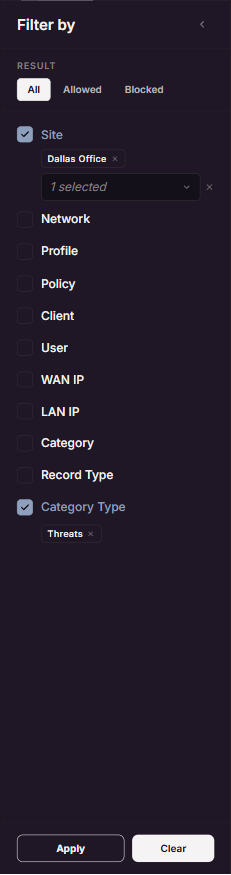
[!IMPORTANT] Filter selections are a draft until you press Apply. Choosing values does not refetch results by itself. If you selected a site and nothing changed, you haven’t applied yet. An indicator shows when your draft differs from what’s currently applied, and Reset clears back to defaults.
Category Type is a one-click rollup: choosing Threats narrows to the whole threat category family (Malware Dist, Phishing, Malware C2, and the rest). This is the same view the Dashboard’s threat banner links to.
Drilling down
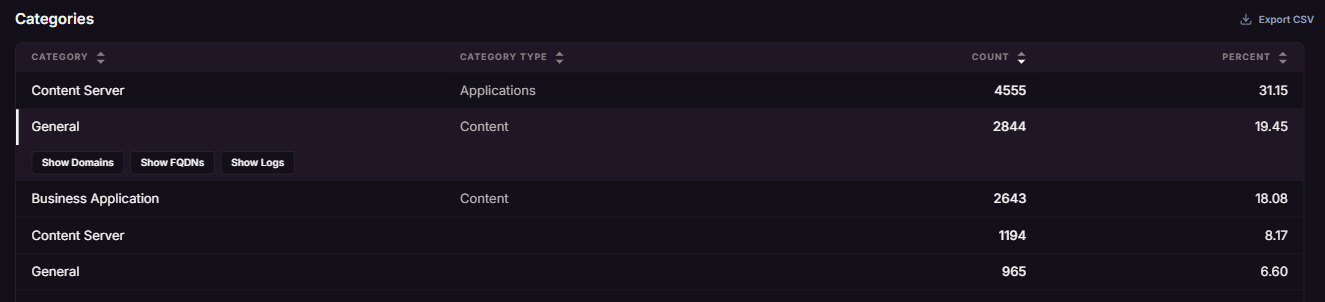
Clicking a row expands a set of drill actions:
- Category, TLD, and record type rows offer Show Domains, Show FQDNs, and Show Logs, so you can jump straight to the level you need.
- Domain rows offer Show FQDNs and Show Logs, plus Lookup and Add to List shortcuts.
- FQDN rows offer Show Logs, Lookup, and Add to List.
Clicking a row opens the chooser in line, directly beneath it:
The breadcrumb shows the drill path, and each crumb is clickable to step back up. Clicking a log line opens the detail drawer with the full query record on the Details tab and the DNS response data on the Response tab.
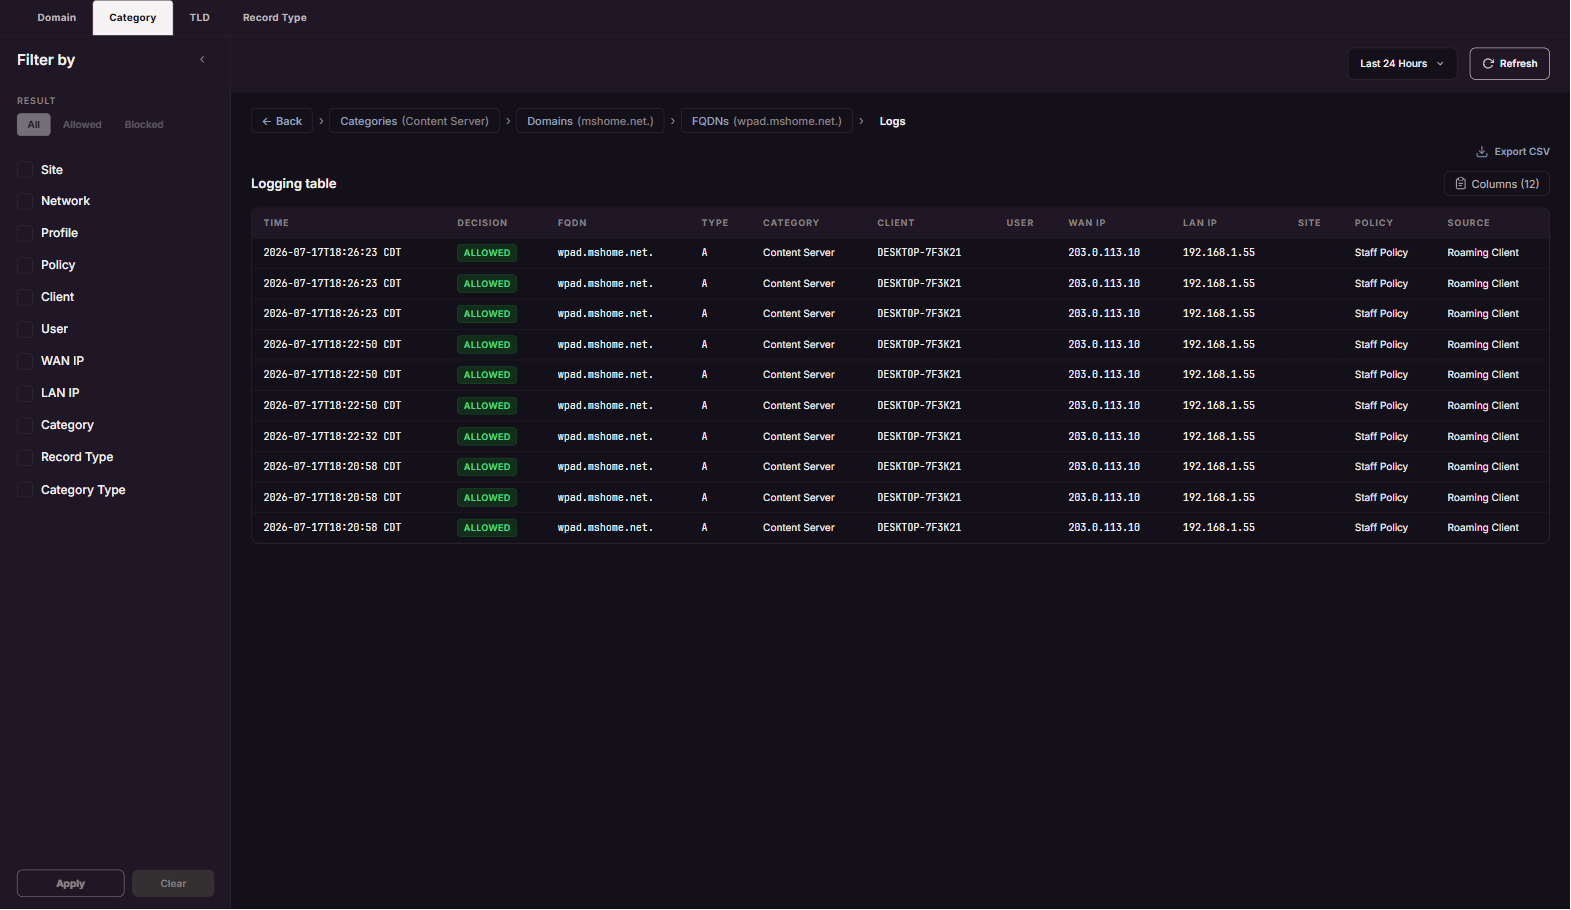
[!NOTE] Drilling is time-range-bound. Changing the range while drilled re-runs the drilled query for the new window. A domain that had no traffic in the new window shows an empty table rather than popping you back to the top level.
Domain vs. FQDN
On the Domain tab, the Domain / FQDN toggle switches aggregation:
- Domain groups traffic by registered domain (
example.com). - FQDN lists full hostnames (
cdn.example.com).
The search box searches whichever mode is active.
Filtering by user
The User filter matches directory usernames synced from Active Directory or Entra ID.
[!NOTE] Per-user attribution requires the current ScoutDNS Windows agent on the device. Devices running older agents appear by hostname and IP but not by username, so a user search can legitimately return no rows even though the device’s traffic is present in the account.
Exporting and sharing
- Export CSV downloads exactly the current view: the active tab, drill level, applied filters, and result selection, with plain-English column names. It is not a full-account dump.
- Share a view by copying the address bar. The URL always encodes the full state (tab, range, filters, drill position), so a bookmark or pasted link reproduces the exact view for anyone with portal access.

FAQ
I set filters but the results didn’t change. Press Apply. Filter choices are a draft until applied.
A user search returns nothing but I know the device is active. Check the device agent version. Older agents report by hostname and IP only; per-user attribution needs the current Windows agent. Search by client or LAN IP instead.
My exported CSV has fewer rows than I expected. Export reflects the current drill level and applied filters, not the whole account. Step back to the top level and clear filters for the widest export.
Related
- Dashboard overview, the summary view whose panels link into Insights
- Tracking individual users, how per-user attribution works
- SIEM data export, continuous log export as an alternative to manual CSV
- Working with policies, the policies referenced by the Policy filter